Hi, welcome to my webpage! This page provides an overview of electric vehicle (EV) sales in the United States from 2017 to 2019, highlighting key trends and top-selling models.
| Model | Manufacturer | Vehicle Type | Seating | Drivetrain | Battery (kWh) | EPA Range | MPGe | 0-60 mph | Motor Config | DC Fast Charge | MSRP (2017-19) | 2017 Sales | 2018 Sales | 2019 Sales |
|---|---|---|---|---|---|---|---|---|---|---|---|---|---|---|
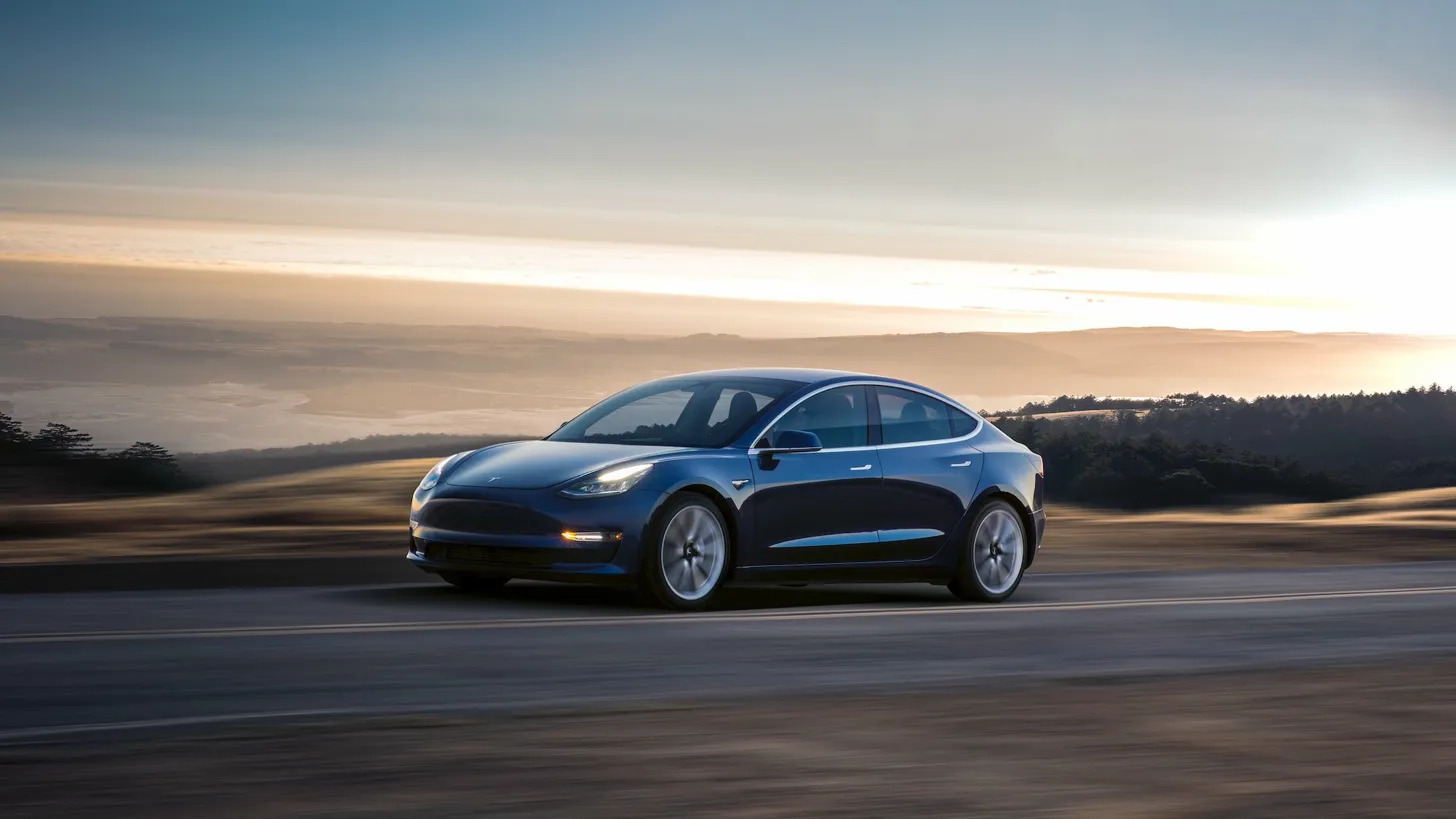
| Tesla Model 3 | Tesla | Sedan | 5 | RWD / AWD | 75 kWh | 310 miles | 116-130 | 3.3-5.6 sec | Single / Dual Motor | Tesla Supercharger | $36,200 - $60,000 | 1,770 | 139,782 | 154,840 |
| Tesla Model X | Tesla | SUV | 5-7 | AWD | 100 kWh | 295 miles | 85-96 | 2.9-4.9 sec | Dual Motor | Tesla Supercharger | $84,000 - $141,000 | 21,700 | 26,100 | 19,425 |
| Tesla Model S | Tesla | Sedan | 5-7 | RWD / AWD | 100 kWh | 335 miles | 98-104 | 2.5-5.5 sec | Single / Dual Motor | Tesla Supercharger | $68,000 - $135,000 | 26,500 | 25,745 | 15,090 |
| Prius PHEV | Toyota | Hatchback | 4 | FWD | 8.8 kWh | 25 miles* | 133 | 10-11 sec | Single Motor + ICE | Not Supported | $27,000 - $34,000 | 20,269 | 27,595 | 23,630 |
| Chevy Bolt | Chevrolet | Hatchback | 5 | FWD | 60 kWh | 238 miles | 119 | 6.3-6.5 sec | Single Motor | CCS | $36,000 - $41,000 | 23,297 | 18,019 | 16,418 |
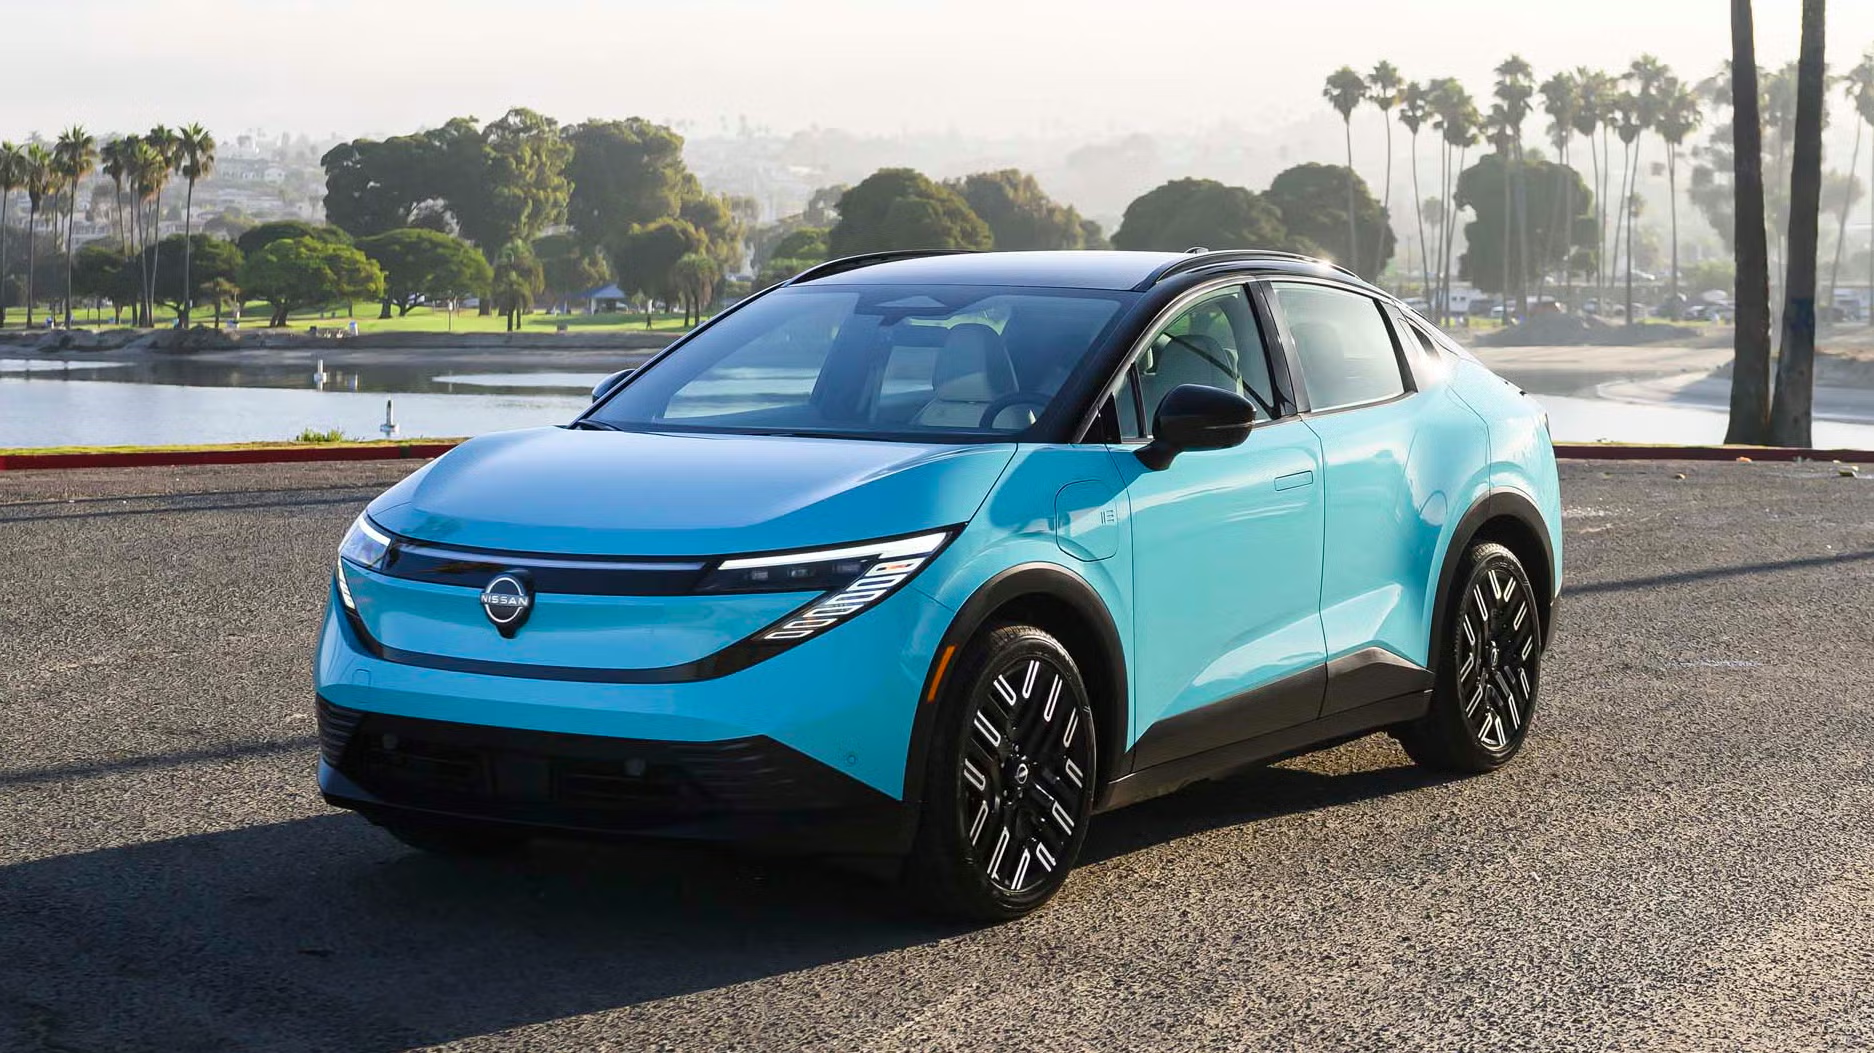
| Nissan Leaf | Nissan | Hatchback | 5 | FWD | 30-62 kWh | 107-226 miles | 114-124 | 6.5-10 sec | Single Motor | CHAdeMO | $30,000 - $38,000 | 11,230 | 14,715 | 12,365 |
| Chevy Volt | Chevrolet | Sedan | 5 | FWD | 18.4 kWh | 53 miles* | 106 | 7.5 sec | Dual Motor + ICE | Not Supported | $33,000 - $38,000 | 20,349 | 18,306 | 7,142 |
| Honda Clarity | Honda | Sedan | 5 | FWD | 17 kWh | 47 miles* | 110 | 7.7-9 sec | Single Motor + ICE | Not Supported | $33,000 - $38,000 | 1,681 | 18,602 | 11,654 |
| BMW i3 | BMW | Hatchback | 4 | RWD | 33 kWh | 114 miles | 118-124 | 6.8-7.3 sec | Single Motor | CCS | $42,000 - $48,000 | 6,276 | 6,117 | 4,954 |
| Ford Fusion Energi | Ford | Sedan | 5 | FWD | 9 kWh | 26 miles* | 104 | 8-9 sec | Single Motor + ICE | Not Supported | $32,000 - $42,000 | 11,654 | 8,138 | 5,346 |
| BMW 5-Series Plug-in | BMW | Sedan | 5 | RWD / AWD | 9.2 kWh | 16 miles* | 66 | 5.5-6 sec | Single Motor + ICE | Not Supported | $58,000 - $70,000 | 1,809 | 2,810 | 2,876 |
| Audi e-tron | Audi | SUV | 5 | AWD | 95 kWh | 204 miles | 74-77 | 5.5 sec | Dual Motor | CCS | $74,000 - $82,000 | - | - | 5,369 |
| Chrysler Pacifica PHEV | Chrysler | Minivan | 7 | FWD | 16 kWh | 33 miles* | 84 | 7-8 sec | Dual Motor + ICE | Not Supported | $42,000 - $48,000 | 3,659 | 4,474 | 4,516 |
| VW e-Golf | Volkswagen | Hatchback | 5 | FWD | 35.8 kWh | 125 miles | 119-126 | 9.6 sec | Single Motor | CCS | $31,000 - $34,000 | 4,253 | 5,533 | 5,582 |
| Kia Niro Plug-in | Kia | Crossover | 5 | FWD | 8.9 kWh | 26 miles* | 105 | 9 sec | Single Motor + ICE | Not Supported | $28,000 - $36,000 | - | 2,418 | 6,298 |
*Electric-only range for plug-in hybrid vehicles (PHEV). Total range includes gasoline engine.
All data represents typical specifications across 2017-2019 model years. Some specifications varied between years and trim levels.
Market Growth: The U.S. electric vehicle market experienced significant growth from 2017 to 2019, with annual EV sales reaching over 320,000 units by 2019.
Tesla Dominance: Tesla's Model 3 became the best-selling EV in America by 2018, capturing approximately 50% of the market share. The dramatic production increase from 1,770 units in 2017 to 139,782 units in 2018 represented an 8,600% growth year-over-year.
Technology Diversity: The market showed diverse charging standards (Tesla Supercharger, CCS, CHAdeMO) and varied vehicle types (sedans, hatchbacks, SUVs, crossovers, and minivans), providing consumers with multiple options.
Performance Evolution: Pure EVs demonstrated impressive acceleration capabilities, with some models (Tesla Model S P100D, Model X P100D) achieving 0-60 mph times under 3 seconds, rivaling high-performance sports cars.
Range Improvements: Battery technology advanced significantly during this period. The Nissan Leaf evolved from a 30 kWh battery (107-mile range) to a 62 kWh option (226-mile range). Tesla maintained its lead with ranges exceeding 300 miles.
Plug-in Hybrid Segment: PHEVs like the Prius Prime, Chevy Volt, and Honda Clarity offered electric-only ranges of 25-53 miles, appealing to consumers concerned about range anxiety while maintaining gasoline backup capability.
Efficiency Leaders: The Toyota Prius Prime led in MPGe ratings at 133, while pure EVs like the BMW i3 (124 MPGe) and Nissan Leaf (124 MPGe) offered exceptional efficiency compared to traditional gasoline vehicles.
Premium Segment Growth: Luxury manufacturers (BMW, Audi) entered the market with premium EV offerings, expanding consumer choice beyond economy-focused models.
| Model | 2017 Sales | 2018 Sales | 2019 Sales | Total (2017-2019) |
|---|---|---|---|---|
| Tesla Model 3 | 1,770 | 139,782 | 154,840 | 296,392 |
| Tesla Model S | 26,500 | 25,745 | 15,090 | 67,335 |
| Tesla Model X | 21,700 | 26,100 | 19,425 | 67,225 |
| Total Tesla Sales | 49,970 | 191,627 | 189,355 | 430,952 |
| Year | U.S. Sales | Battery Capacity | EPA Range |
|---|---|---|---|
| 2017 | 11,230 | 30 kWh | 107 miles |
| 2018 | 14,715 | 40 kWh | 150 miles |
| 2019 | 12,365 | 40 / 62 kWh | 150 / 226 miles |
Historical Context: The Nissan Leaf was the world's best-selling EV from 2011-2014 and again in 2016, with over 650,000 units sold globally since December 2010. By 2019, it had sold 165,000+ units in the United States alone.
Pricing (2026 Model Year):
Range & Battery:
Charging:
Performance:
Term meanings
All info and data found on this page can attributed to energy.gov/data and U.S. Energy Information Administration.