Original Dataset
Data pulled live from Gigasheet's Movies Daily Update Dataset (top rows sorted by popularity). Budget and revenue are in millions USD. "—" indicates streaming-only or unreported box office.
| # | Title | Genre | Year | Budget ($M) | Revenue ($M) | ROI | Runtime | Vote Avg | Vote Count | Popularity |
|---|
Charts & Analysis
Chart 1 — Budget vs. Box-Office Revenue (Top 18 Theatrical Releases)
Each pair of bars shows what a studio spent (blue) vs. what it earned at the box office (green), in millions USD. Only films with known theatrical figures are included.
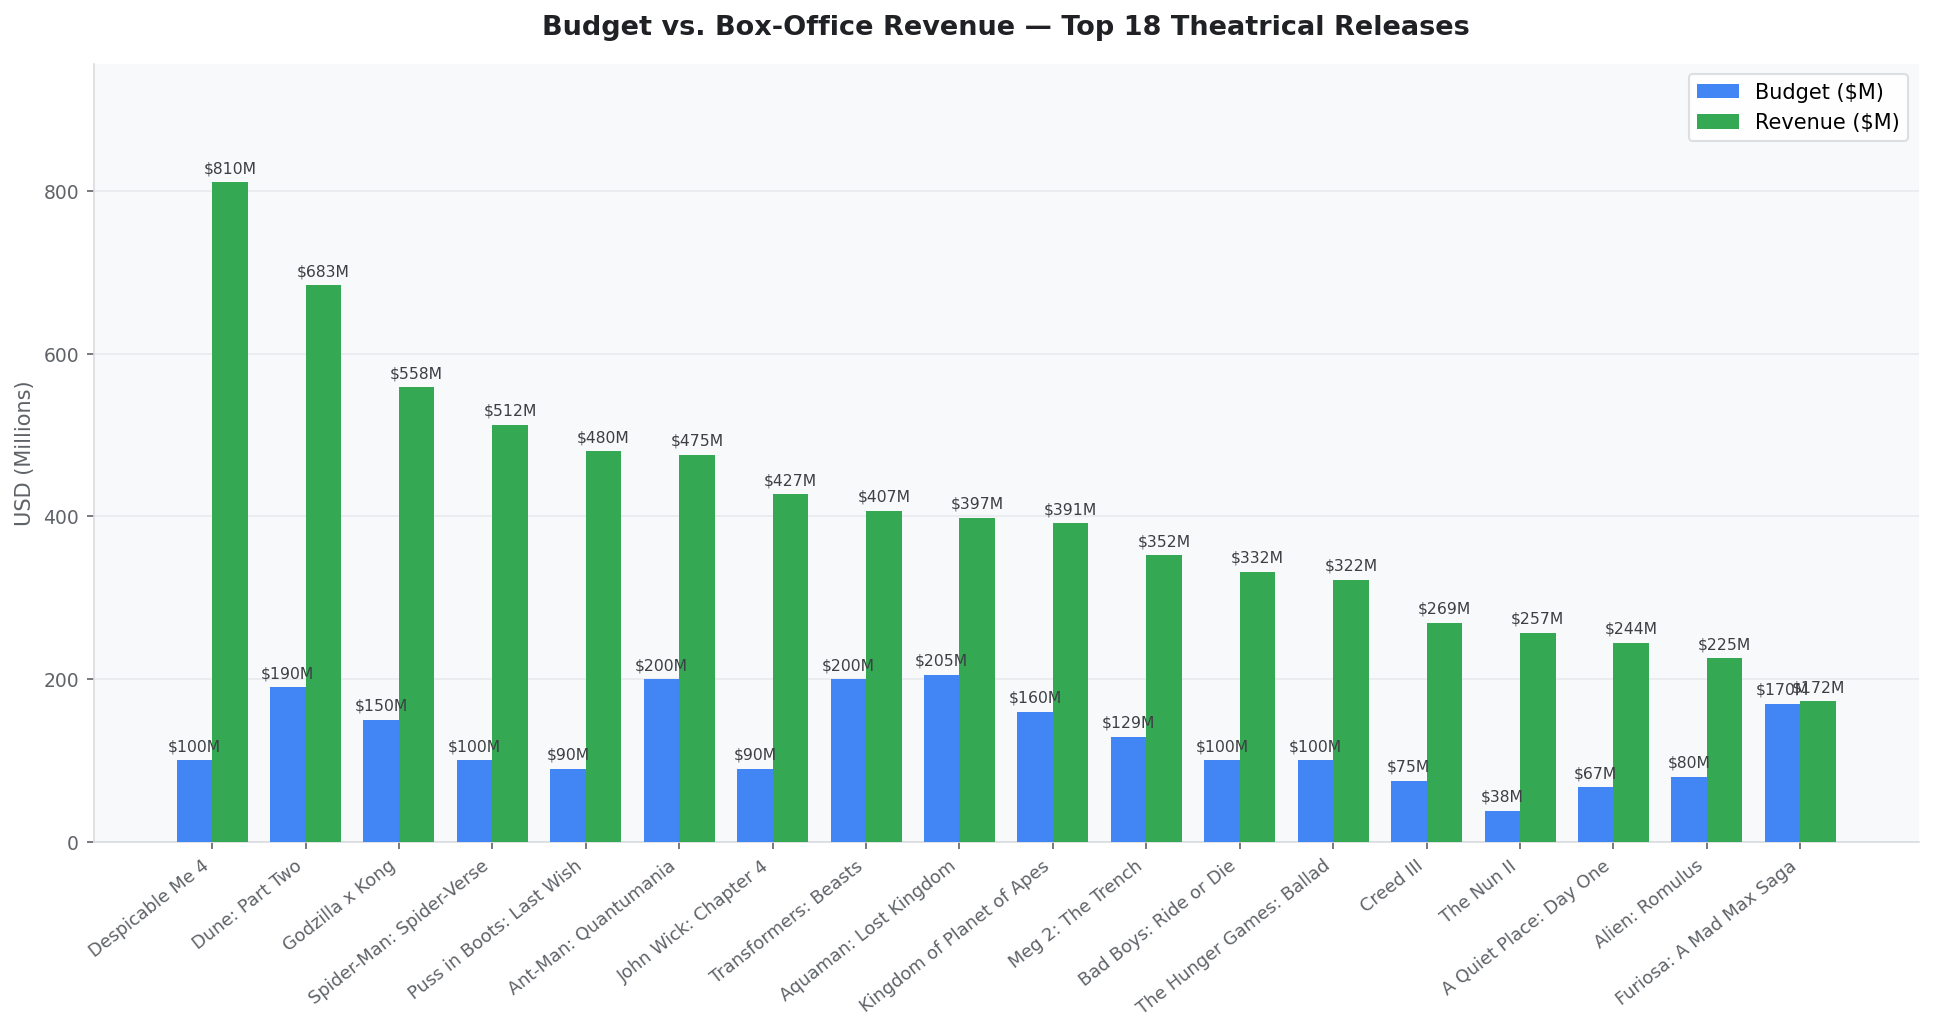
Analysis: Big budgets are no guarantee of big returns.
Despicable Me 4 turned a $100M budget into $810M revenue — an 8× return — while
mega-budget titles like Aquaman and the Lost Kingdom ($205M) and
The Little Mermaid ($250M) barely broke even or underperformed.
Furiosa ($170M budget, $172M revenue) is a near-perfect break-even case.
It can be inferred that franchise goodwill and appealing to audiences matter more than raw spend.
A beloved animated property can vastly out-earn a bloated live-action sequel.
Chart 2 — Average Audience Rating by Primary Genre
Mean TMDB vote average (0–10 scale) grouped by a film's primary genre. The number in parentheses shows how many films fall in each genre from this dataset.
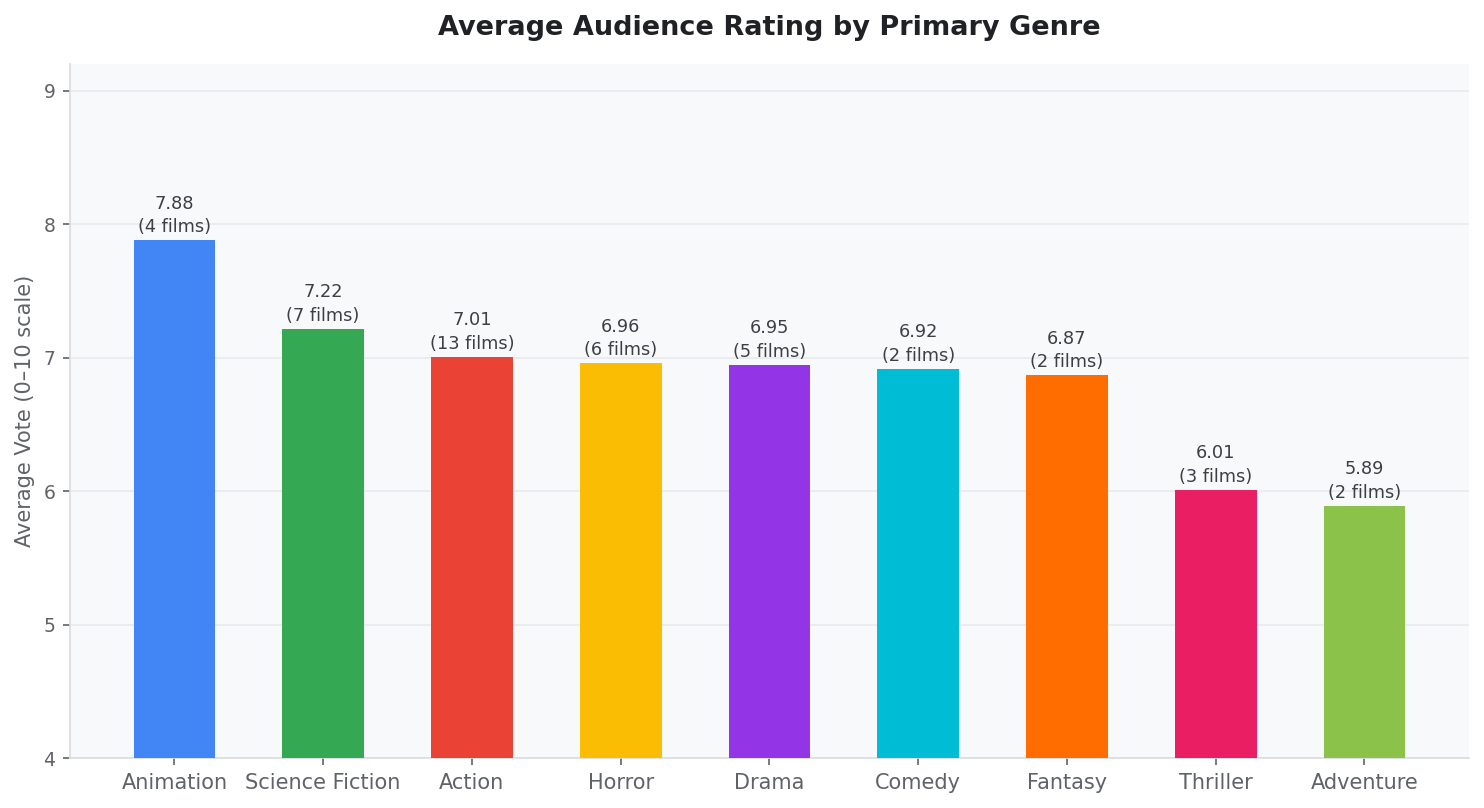
Analysis: Animation leads all genres by a wide margin (avg ≈ 7.88),
powered by things such as Spider-Man: Across the Spider-Verse (8.64) and
Puss in Boots: The Last Wish (8.28).
Science Fiction follows closely, by Dune: Part Two (8.3).
Adventure scores lowest, dragged down by Disney's live-action remakes
and Thriller is inconsistent with a few poor-reviewed entries.
The data argues that originality and craft earn ratings; genre alone does not.
Action films are the most numerous but rarely exceptional.
Chart 3 — Popularity vs. Audience Rating (Scatter Plot)
Each dot represents one film. X-axis = TMDB vote average; Y-axis = TMDB popularity score (search traffic + activity). Color encodes primary genre. Standout films are labelled.
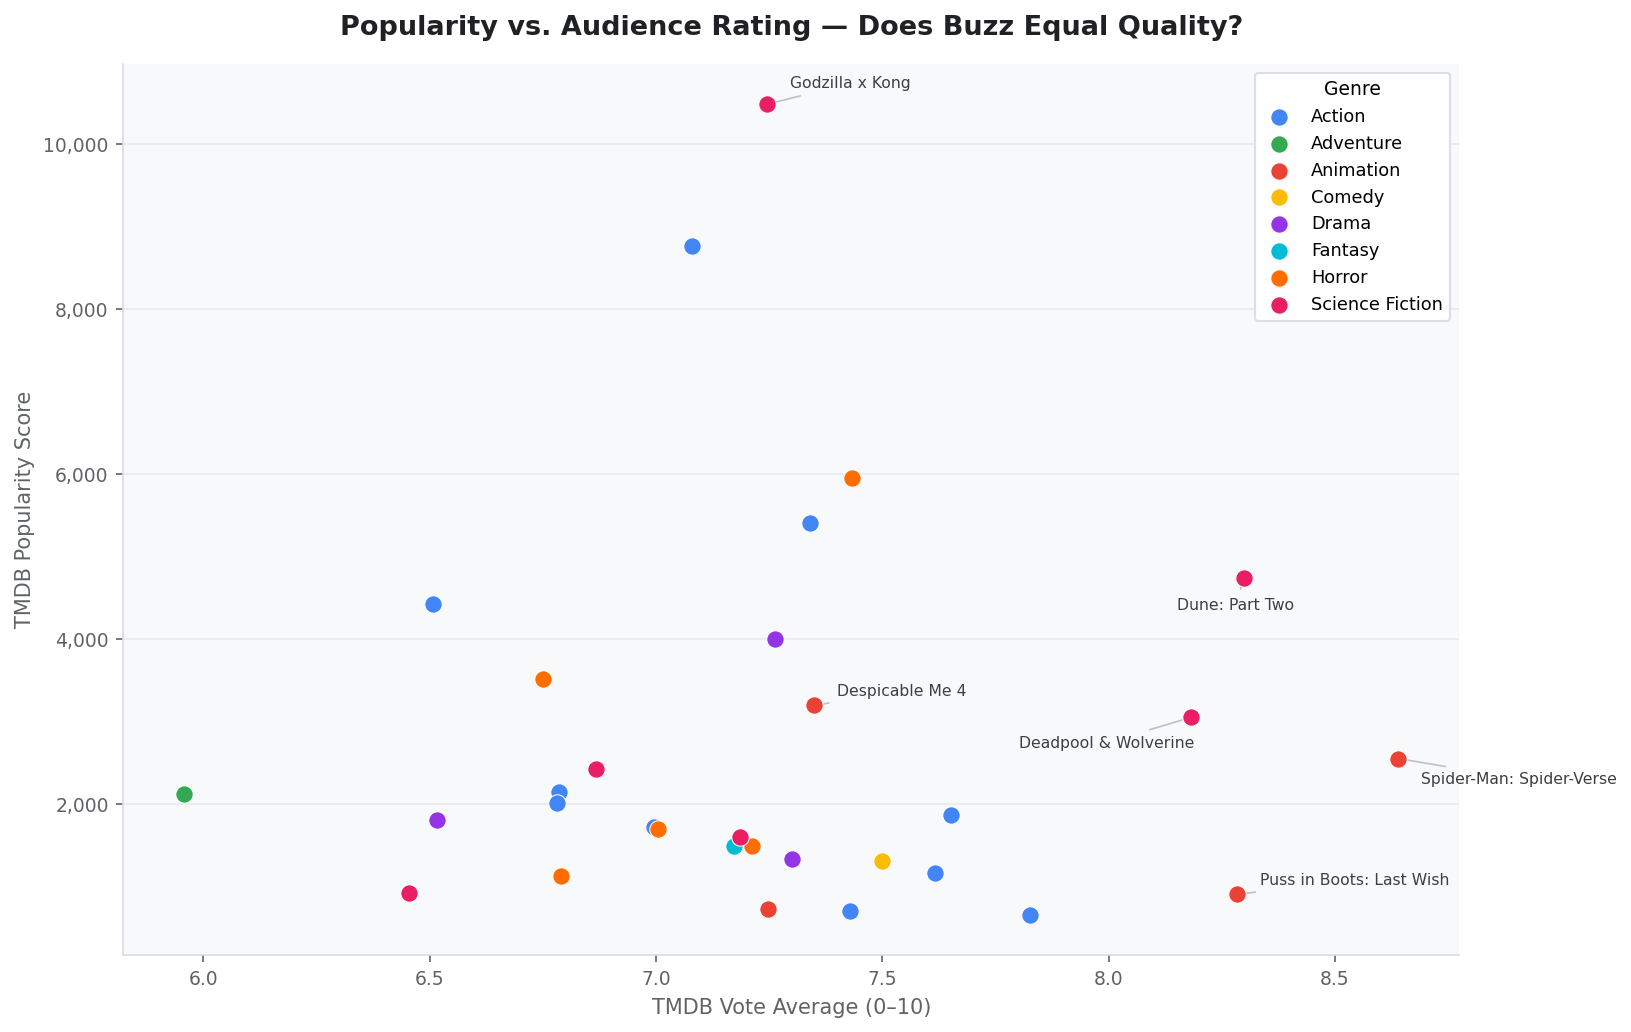
Analysis: The scatter reveals a striking disconnect,
high popularity does not reliably predict high ratings.
Godzilla x Kong sits at the very top of the popularity axis (10,484) with only a
middling 7.2 rating, while Spider-Man: Across the Spider-Verse earns the highest
rating in the dataset (8.64) with far lower popularity.
This tells us that TMDB popularity captures short-term social buzz and search traffic,
largely driven by franchise marketing, rather than genuine audience esteem.
Studios can manufacture popularity through marketing muscle; they cannot manufacture quality.
Films that combine both (Dune: Part Two, Deadpool & Wolverine) represent the
industry ideal.