01 / 05

Electric Vehicle
Sales Analysis
(2017–2019)

This presentation provides an overview of electric vehicle (EV) sales in the United States from 2017 to 2019, highlighting key trends, top-selling models, and the competitive landscape that shaped the modern EV market.

320K+
annual EV units sold by 2019
~50%
Tesla's U.S. market share
8,600%
Model 3 YoY growth '17→'18
02 / 05

Top-Selling Electric Vehicles — Comprehensive Specifications

Table 1: Top-Selling Electric Vehicles in the U.S. (2017–2019)

Model Mfr. Type Battery EPA Range MPGe 0–60 DC Fast Charge MSRP 2017 2018 2019
Tesla Model 3TeslaSedan 75 kWh310 mi116–1303.3–5.6s Tesla SC$36,200–$60,000 1,770139,782154,840
Tesla Model XTeslaSUV 100 kWh295 mi85–962.9–4.9s Tesla SC$84,000–$141,000 21,70026,10019,425
Tesla Model STeslaSedan 100 kWh335 mi98–1042.5–5.5s Tesla SC$68,000–$135,000 26,50025,74515,090
Prius PHEVToyotaHatchback 8.8 kWh25 mi*13310–11s Not Supported$27,000–$34,000 20,26927,59523,630
Chevy BoltChevroletHatchback 60 kWh238 mi1196.3–6.5s CCS$36,000–$41,000 23,29718,01916,418
Nissan LeafNissanHatchback 30–62 kWh107–226 mi114–1246.5–10s CHAdeMO$30,000–$38,000 11,23014,71512,365
Chevy VoltChevroletSedan 18.4 kWh53 mi*1067.5s Not Supported$33,000–$38,000 20,34918,3067,142
Honda ClarityHondaSedan 17 kWh47 mi*1107.7–9s Not Supported$33,000–$38,000 1,68118,60211,654
BMW i3BMWHatchback 33 kWh114 mi118–1246.8–7.3s CCS$42,000–$48,000 6,2766,1174,954
Audi e-tronAudiSUV 95 kWh204 mi74–775.5s CCS$74,000–$82,000 5,369
VW e-GolfVWHatchback 35.8 kWh125 mi119–1269.6s CCS$31,000–$34,000 4,2535,5335,582

*Electric-only range for plug-in hybrid vehicles (PHEV). All data represents typical specs across 2017–2019 model years.

03 / 05

Analysis — Key Findings & Market Trends

Key Findings

📈 Market Growth

The U.S. EV market experienced significant growth from 2017 to 2019, with annual EV sales reaching over 320,000 units by 2019, representing dramatic year-over-year gains.

🔋 Tesla Dominance

Tesla's Model 3 became the best-selling EV in America by 2018, capturing approximately 50% of the market share. Production increased from 1,770 units (2017) to 139,782 units (2018) — an 8,600% jump year-over-year.

⚡ Technology Diversity

The market showed diverse charging standards (Tesla Supercharger, CCS, CHAdeMO) and varied vehicle types — sedans, hatchbacks, SUVs, crossovers, and minivans — providing consumers with multiple options.

🏎️ Performance Evolution

Pure EVs demonstrated impressive acceleration, with the Tesla Model S and Model X P100D achieving 0–60 mph times under 3 seconds, rivaling high-performance sports cars.

Market Trends

🔬 Range Improvements

Battery technology advanced significantly. The Nissan Leaf evolved from a 30 kWh battery (107-mile range) to a 62 kWh option (226-mile range). Tesla maintained its lead with ranges exceeding 300 miles.

🔌 Plug-in Hybrid Segment

PHEVs like the Prius Prime, Chevy Volt, and Honda Clarity offered electric-only ranges of 25–53 miles, appealing to consumers concerned about range anxiety while maintaining gasoline backup capability.

🏆 Efficiency Leaders

The Toyota Prius Prime led in MPGe ratings at 133, while pure EVs like the BMW i3 and Nissan Leaf (both 124 MPGe) offered exceptional efficiency compared to traditional gasoline vehicles.

💎 Premium Segment Growth

Luxury manufacturers (BMW, Audi) entered the market with premium EV offerings, expanding consumer choice beyond economy-focused models.

04 / 05

Tesla Models Performance — Figure 1: Best-Selling EV in U.S. History

296,392
Tesla Model 3 units sold (2017–2019 combined)
Model 2017 Sales 2018 Sales 2019 Sales Total (2017–2019)
Tesla Model 3 1,770139,782154,840 296,392
Tesla Model S 26,50025,74515,090 67,335
Tesla Model X 21,70026,10019,425 67,225
Total Tesla Sales 49,970191,627189,355 430,952

Tesla dominated the premium EV segment, accounting for over 60% of total U.S. EV sales during this period.

Model 3 Production Growth

2017
1,770
2018
139,782
2019
154,840
Tesla Model 3 — Best-Selling EV in U.S. History
Figure 1: Tesla Model 3 — Best-Selling EV in U.S. History
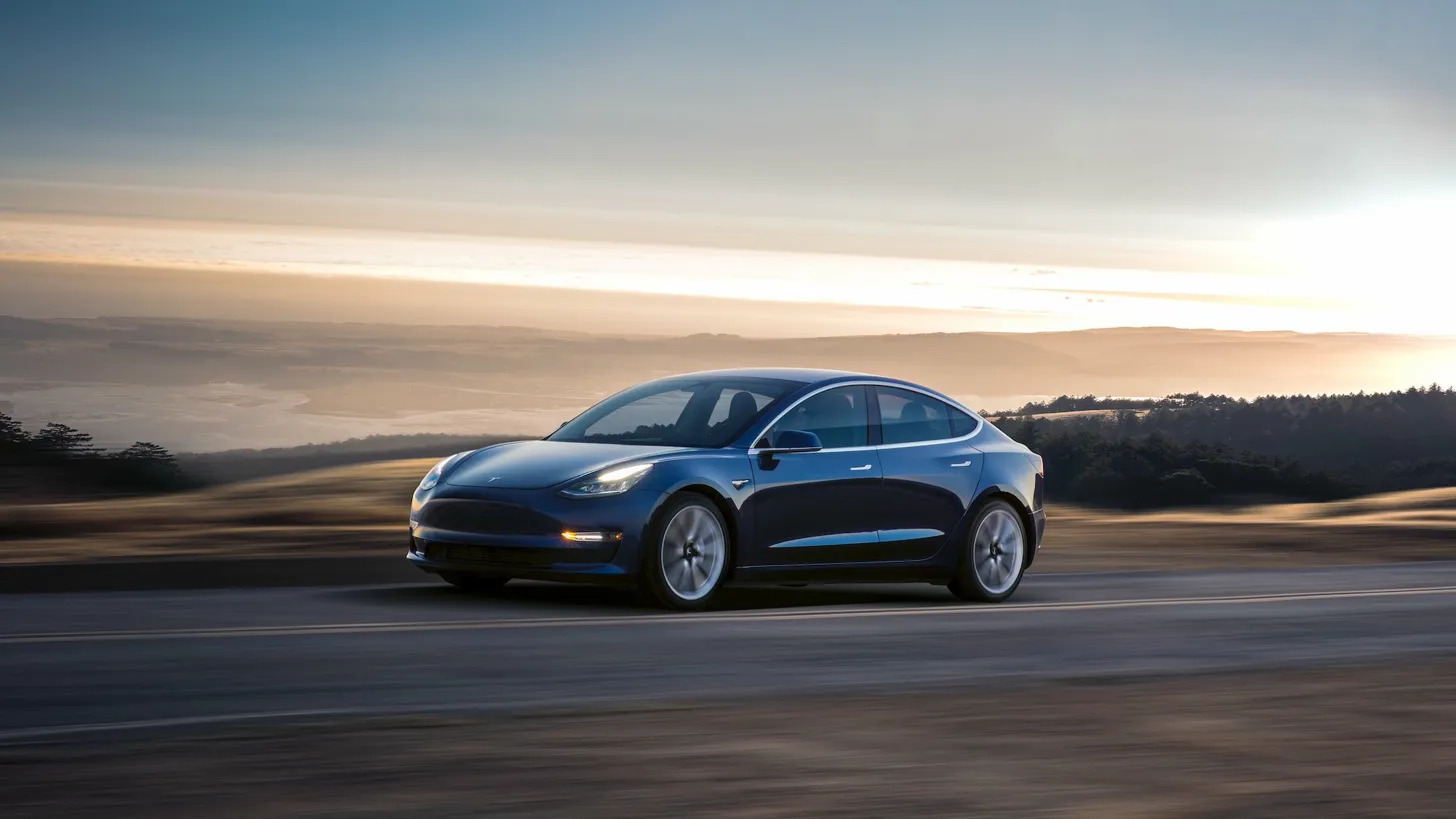
Why the Model 3 won: The Model 3 brought Tesla's technology to a mass-market price point, combining 310+ mile range, over-the-air software updates, and access to the world's largest fast-charging network — at a starting price of $36,200.
05 / 05

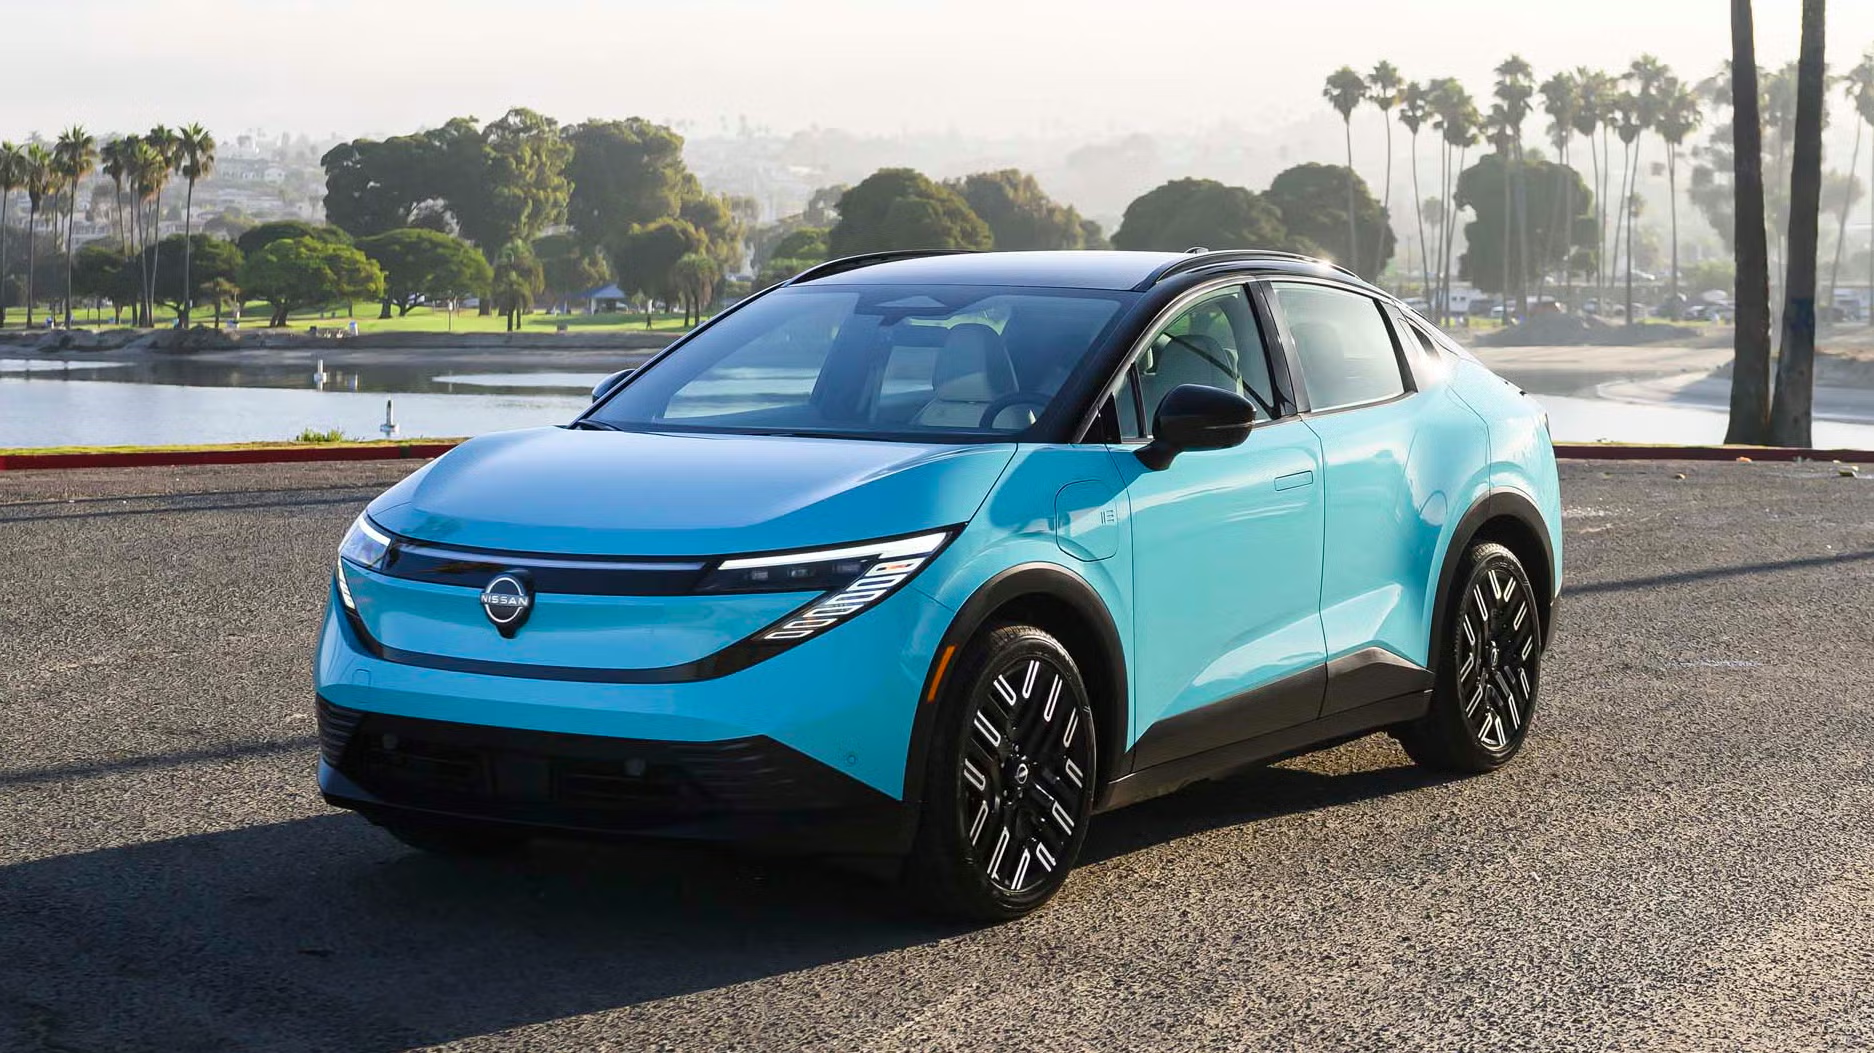
Affordable EV Alternative — Cheapest Alternative to a Tesla: Nissan Leaf

Nissan Leaf Historical Performance (2017–2019)

Year U.S. Sales Battery Capacity EPA Range
201711,23030 kWh107 miles
201814,71540 kWh150 miles
201912,36540 / 62 kWh150 / 226 miles

Historical Context: The Nissan Leaf was the world's best-selling EV from 2011–2014 and again in 2016, with over 650,000 units sold globally since December 2010.

2026 Nissan Leaf Specifications

Pricing (2026 Model Year)

S+ Trim: $29,990 (lowest-priced new EV in U.S.)
SV+ Trim: $34,230  |  Platinum+ Trim: $38,990

Range & Battery

75 kWh liquid-cooled lithium-ion battery
S+: 303 mi  |  SV+: 288 mi  |  Platinum+: 252 mi
150 kW DC fast charging — 10–80% in 35 min

Performance

214 hp, 262 lb-ft torque  |  0–60: 6.8 sec  |  121 MPGe combined
Standard NACS port (access to 25,000+ Tesla Superchargers)
2026 Nissan Leaf — America's Most Affordable EV
Figure 2: 2026 Nissan Leaf — America's Most Affordable EV
Source: All info and data found on this page can be attributed to energy.gov/data and the U.S. Energy Information Administration.

Glossary

RWD / FWD / AWDRear / Front / All Wheel Drive
Battery kWhKilowatt hours (energy storage)
EPA RangeDriving range calculated by the EPA
MPGeMiles per gallon equivalent
MSRPManufacturer's Suggested Retail Price